Halloween Strategy
Based on the idea that equities perform better from October 31 (Halloween) to May 1


What Is the Halloween Strategy?
A market timing approach known as the Halloween strategy, Halloween effect, or Halloween indication is based on the idea that equities perform better from October 31 (Halloween) to May 1 than they do from the start of May to the end of October.
According to the method, it is recommended to invest in equities in November, keep them through the winter, and then sell them in April. From May through October, you should invest in other asset classes. Some proponents of this strategy advise against investing at all in the summer.
Contrary to the buy-and-hold approach, which allows investors to ride out market downturns and make longer-term investments, the notion that investors can time the market in this way is unfounded. The better outcomes appear to run counter to the idea that stocks act fully arbitrarily and against the efficient market concept.
The recommendation to sell in May and leave is strongly similar to the Halloween tactic. It is important to remember that this tactic has been used in some form for a very long time.
Over the last two centuries, the maxim frequently used in the financial media has also been used, and its lengthier version is like this: "Sell in May, leave away, come again, St. Leger Day."
Many people think the idea of selling stocks in May each year originated in Britain when the privileged class would leave London and travel to their country estates for the summer, mainly disregarding their investment portfolios, until coming back in September.
According to those who hold this belief, it is normal for salespeople, traders, brokers, equities analysts, and other members of the investing industry to retreat to sanctuaries like the Hamptons in New York, Nantucket in Massachusetts, and its counterparts abroad during the summer months.
Origin of the Halloween Strategy
This tactic first appeared in London, England, in the 16th century. The adage "sell in May and go away" was regularly used in British newspapers. It gained popularity among individual investors in the 1980s after The Wall Street Journal published an article on the British stock market.
The phrase implied that May marks the beginning of a bear market and that investors should liquidate their positions and keep cash instead.
Michael O'Higgins and John Downes published "Beating the Dow" in 1990. The investing strategy book made the Halloween indicator popular and drew on the British proverb "sell in May and go away."
O'Higgins and Downes advised investors to enter the stock market on October 31 and leave the market on April 30 in their book.
In a study titled "The Halloween Indicator," written by Sven Bouman and Ben Jacobsen and published in the American Economic Review, they particularly examined market performance from November through April.
According to their observations, a stock investor who used this strategy to be fully invested for one six-month period and out of the market for the other six months of the year would theoretically benefit from the best annual return but with only half the exposure of a stock investor who invests in stocks year-round.
Performance of the Halloween Strategy
There is proof of the Halloween tactic that should be taken into account. The Halloween strategy's central tenet—that investors have seen more financial gains from November through April than during any other time of the year—seems to have held mostly true for the previous fifty years, according to historical stock returns.
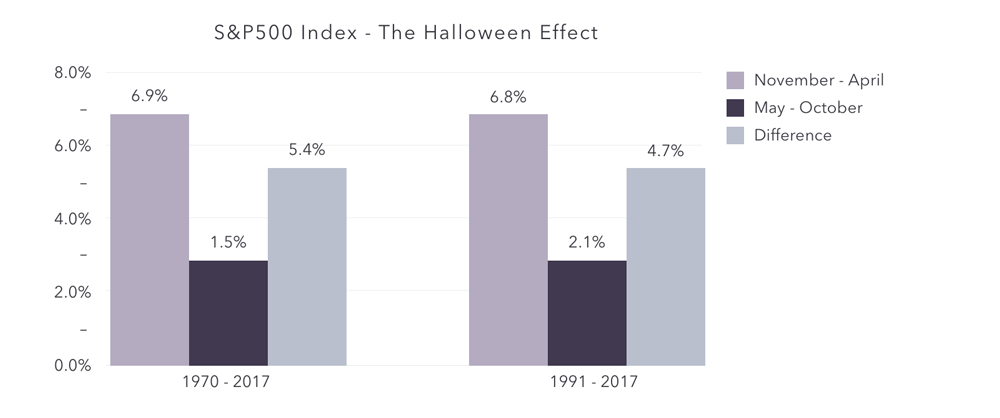
The findings also indicate that a May selling strategy may outperform the market more than 80% of the time when utilized over a five-year horizon and more than 90% of the time when used over a ten-year horizon.
Halloween Strategy FAQs
The cause of this seasonal abnormality has not been definitively determined. Although many market observers think that investment professionals' summer vacations affect market liquidity, these ideas presuppose that increased participation equates to increased profits.
However, the largest levels of volume and engagement are seen during market collapses and other such investment catastrophes. As a result, while the assumption of greater involvement may have some association with advantages, it is unlikely that it will result in those gains.
Since computerized trading enables investors to engage anywhere in the world—from the beach to the boardroom—proximity to trading resources is also unlikely to be an explanation.
Whatever one wants to think about the Halloween strategy, there are plenty of ideas to back it up. There are as many different hypotheses explaining the Halloween effect as there are various viewpoints on it. The Halloween tactic is intriguing since it is both an empirical oddity and a mystery.
Yes. The National Retail Federation estimates that American spending on Halloween will reach $10.14 billion in 2021 and has been continuously increasing over several years. Individual expenditures were anticipated to total $102.74 for items like candy, decorations, costumes, pumpkins, party materials, and cards.
This tactic has been present in some form for a very long time. Over the last two centuries, the lengthier version of the maxim frequently used in the financial media goes something like this: "Sell in May, leave away, come again, St. Leger Day."
The concept of Halloween approaching that the months from November through April genuinely rewarded investors with larger capital gains than the other months of the year seems to have been true for most of the previous 50 years, based on historical stock returns.
The results also demonstrate that a May selling strategy is more than 80% successful in outperforming the market when utilized over a five-year horizon and more than 90% successful when used over a ten-year horizon.
The January effect is an illustration of a calendar timing anomaly. Because of a surge in stock purchases brought on by the typical price decline that takes place in December, equities have a seasonal propensity to climb in January.
Investors who use tax losses to offset capital gains made during the year are to blame for the decline in capital appreciation in December.
-
January barometer: The stock market's performance in January foretells the year's performance.
-
The Mark Twain effect: October stock returns are lower than those of other months. This one comes from Pudd'nhead Wilson by Mark Twain.
-
Santa Claus rally: Describes a steady rise in the stock market that takes place during the first two trading days of January.
-
July effect: Also known as the July phenomena, this is the perceived increase in the danger of surgical complications and the risk of medical mistakes. According to reports, market confidence, Christmas bonuses, and tax concerns are the main factors.
-
Super Bowl indicator: According to the belief, a team from the National Football League's American Football Conference winning the Super Bowl foretells a bear market the following year. A bull market is predicted for the next year if a team from the opposing National Football Conference wins the Super Bowl.


or Want to Sign up with your social account?