STDEV.S Function
An Excel Statistical Function used to calculate the standard deviation of a set of numbers.

What is the STDEV.S Function?
The STDEV.S is an Excel Statistical Function used to calculate the standard deviation of a set of numbers. It is estimated based on a sample, ignoring logical values and text in the sample.
Let's say you have a set of numbers in Excel, and you need to find out how spread out they are from the mean. You can do that by calculating the standard deviation using the STDEV.S function.
In Excel, there are several standard deviation functions, and they are as follows:
- STDEV - calculates sample standard deviation while ignoring the text and logical values (TRUE or FALSE).
- STDEVP - calculates population standard deviation while ignoring the text and logical values.
- STDEV.S - calculates sample standard deviation while ignoring the text and logical values.
- STDEV.P - calculates population standard deviation while ignoring the text and logical values.
- STDEVA - calculates sample standard deviation while considering text and logical values.
- STDEVPA - calculates population standard deviation while considering text and logical values.
There are many functions for standard deviation, but in this article, we will explore the STDEV.S function. It is important to understand the standard deviation before understanding how the Excel function works.
In statistics, standard deviation measures the spread or dispersion of a set of data. A low standard deviation suggests that the data points in the data set are closer to the mean. A high standard deviation suggests that the data points are spread over a wider range from the mean.

In the case of low standard deviation, since the data points are closer to the mean, the numbers in the data set are quite similar to each other with little variability or uniqueness.
For high standard deviation, since the data points are widely dispersed from the mean, the data set has much more variability.
Standard deviation can show inaccurate results or be manipulated by significantly larger or smaller data points than the rest of the data set. These are called outliers.
Two different formulas calculate the standard deviation. However, the formulas are similar, with the only difference being in the denominator.
The standard deviation for a population

Where:
- σ = population standard deviation
- Σ = represents the sum of (xi – μ) 2
- x = individual value
- μ = mean of the population
- n = total number of the population
The standard deviation for a sample

Where:
- S = Standard deviation of the sample
- Σ = represents the sum of (xi – μ) 2
- x = individual value
- x̄ = mean of the sample
- n = total number of the sample
The difference between the two formulas is that for a sample, instead of n, we use n – 1. This is also called a degree of freedom.
NOTE
The degree of freedom is used to ensure the accuracy and reliability of the statistical analyses.
Key Takeaways
- The STDEV.S function in Excel is a statistical function used to estimate the standard deviation of a sample of numbers, providing a measure of the dispersion or variability of the data points around the sample mean.
- The syntax for the STDEV.S function typically includes one or more arguments representing the sample data. It returns the sample's estimated standard deviation.
- The STDEV.S function can handle numeric values, including integers, decimals, and fractions. It ignores logical values, empty cells, and text values in the sample data.
- The STDEV.S function may return errors if the sample data contains errors or non-numeric values that cannot be processed. In such cases, it may return a #VALUE! error indicating the nature of the problem.
Now that we understand the standard deviation, we can move to the Excel function.
Understanding STDEV.S Function
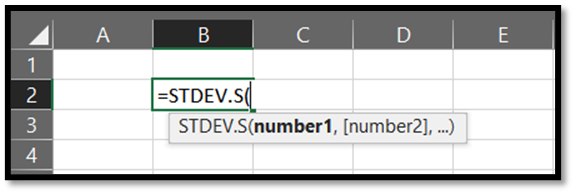
The formula for the function is:

=STDEV.S(number1, [number2], …)
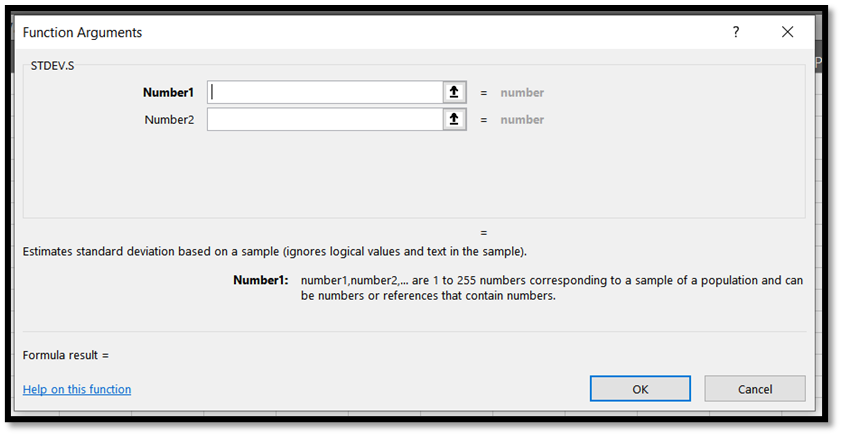
The STDEV.S function uses the following arguments:
1. Number1 (required argument)
This is the first number argument in the formula that corresponds to a sample of a population. It is a required argument that the formula won’t function without.
Instead of inputting multiple values, you can use a single array in this argument that covers the whole data set.
2. Number2 (optional argument)
This is the second number argument in the formula corresponding to a second sample of the population. It is an optional argument; you need not use it if it is not required.
You can also use a single array or a reference to an array in this argument instead of inputting multiple values.
The STDEV.S function is a built-in function in Excel that can be accessed in two ways:
1. Formulas Tab
The function can be found under the formulas tab. You can use the following steps to arrive at it:
Formulas > More Functions > Statistical > STDEV.S

The following will pop up, asking you to specify the numbers you want to calculate the standard deviation for.
2. Entering the formula in a cell
The second method is easier as you only have to type in the formula in any Excel cell without the extra clicking and navigation on the Excel taskbar.
how to use the STDEV.S function with an example
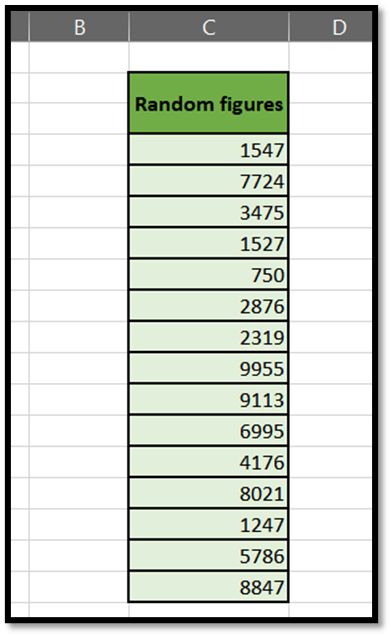
Let us take a few random numbers by using the =RANDBETWEEN function in Excel, as shown below.
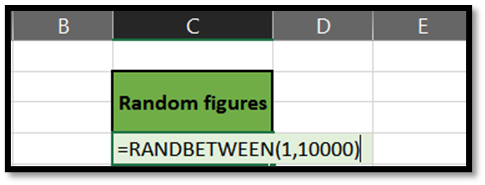
By using this function, Excel will automatically generate numbers between the range of your choice. Here, we have taken between 1 and 10,000. You can drag the formula down to as many cells as you wish, and Excel will generate random numbers for it.
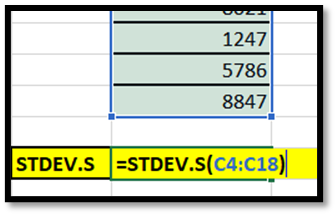
Next, we will input the STDEV.S formula in a cell and select the entire set of numbers to calculate our sample's standard deviation. It is important to note that this function is used for samples and ignores logical values and text in the sample.
However, we can also use this function for practical purposes. For example, if you have a set of numbers representing patients' heartbeats in a medical facility, you can use the STDEV.S function to calculate the standard deviation of all the heartbeat figures.
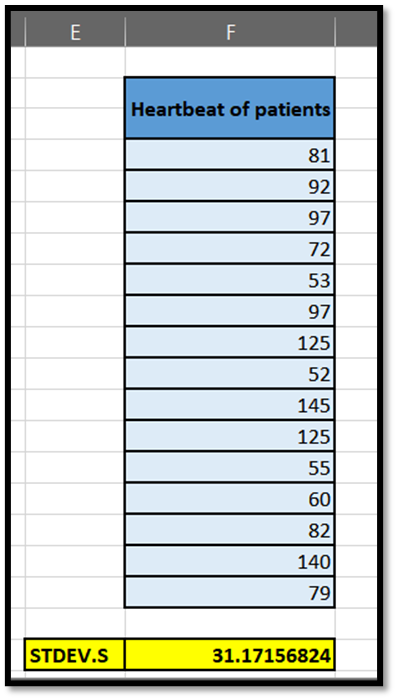
You may be asking, what does a standard deviation of 31.17 mean for the heartbeat figures? To understand that, we must calculate the mean of all the figures. The following formula can be used to calculate the mean of any data set.

In this example,
Mean = Sum of all the heartbeats / Number of heartbeat inputs
Mean = 1,355 / 15 = 90.33
So, a standard deviation of 31.17 indicates that from the mean of 90.33, there is a dispersion of around 31.17 heartbeats above 90.33 and below 90.33 in the sample data set we have of the patients.
Is the STDEV.S function useful?
Yes, the function is useful to easily calculate the standard deviation, as most of it is done by Excel automatically. However, calculating standard deviation is time-consuming even with a moderately sized data set.

The function is particularly useful in statistics, data analytics, and financial analysis. It works best when you only have a sample to work with. If you have a large data set, STDEV.P would be more appropriate.
Regardless, we manually calculated the standard deviation for the same data set in our first example to show you the difference in the time you’ll save using the formula.
The steps to calculate it are as follows:
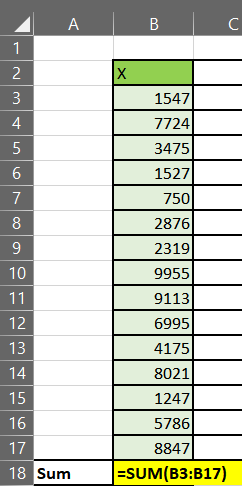
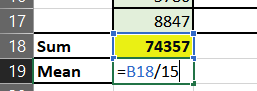
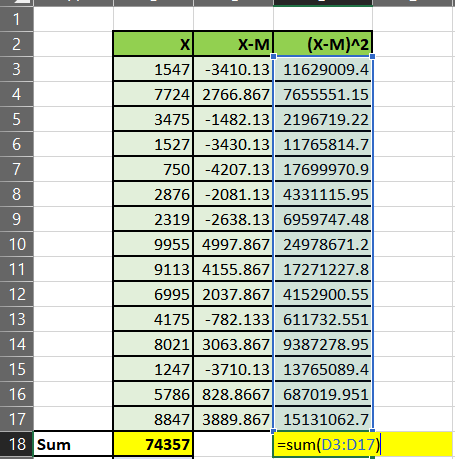
Calculate the sum of all X values using the =SUM() function, which is 74,357.
Next, calculate the mean by dividing the Sum by N, which would be 4,957.133.
Take all the individual x values and subtract them from the mean.
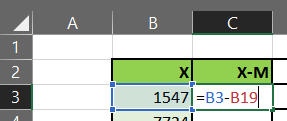
Cell B3 is the first X value, and cell B19 is the mean we calculated. Go ahead and copy this formula for all the remaining values. The next calculation would =B4–B19, and on we go.
You can then square all the (X-M) figures by copying the formula below
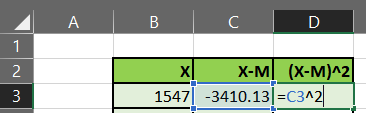
The second calculation would be =C4^2, and the next, =C5^2, until we cover all the (XM) values.
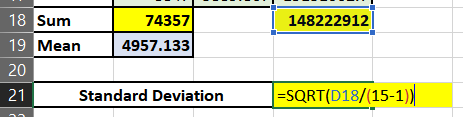
Sum the squared differences by using the =SUM() function again, which would be 148,222,912.
Finally, divide the sum of the squared differences you calculated by N-1. We subtract 1 from N to account for the degree of freedom used for the sample’s calculations. For a population, however, you would simply use N.
So in our example, that would be [148,222,912/(15-1)], which is 10,587,350.8.
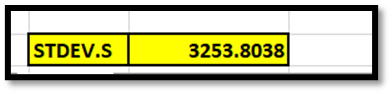
Take the square root of 10,587,350.8, and you will arrive at your standard deviation of 3,253.8.
You can also combine steps 6 and 7 for convenience, as shown below:
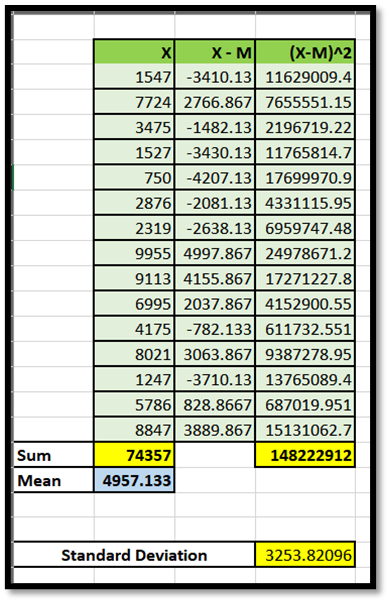
As you can conclude, using the formula in Excel is a lot easier and will save you time instead of manually calculating it.

Free Resources
To continue learning and advancing your career, check out these additional helpful WSO resources:

or Want to Sign up with your social account?