PRICEMAT Function
A Financial Function in Excel that calculates the price of a bond with a face value of $100 that pays interest at maturity.


What is the PRICEMAT Function?
The PRICEMAT function is a Financial Function in Excel that calculates the price of a bond with a face value of $100 that pays interest at maturity.
What is the 'price' in simple terms? It is the amount that needs to be paid in exchange for something.
Generally, bonds are issued in denominations of $100 or even $1000 and traded on the secondary market.
Some bonds, such as Zero coupon bonds, do not make coupon payments but instead pay the accrued interest at the end of the maturity period.
Let's say you intend to buy the bond from the secondary market. If the price for the bond is not quoted, then you can easily calculate the bond's worth by using the available information, such as maturity date, issue date, yield, and interest rate.
The function enables the user to input various arguments, which ultimately helps to calculate the price of those bonds and make an informed decision to purchase securities that best suit the portfolio.
You would find many different functions in Excel, such as PRICE, TBILLPRICE, and PRICEDISC, but they all perform varied tasks.
This article will show the PRICEMAT function, its syntax, and how to use it, along with a couple of examples.
Key Takeaways
- The PRICEMAT function is a Financial Function in Excel that is used to calculate the price per $100 face value of a security that matures at maturity.
- Users provide arguments, including the settlement date, maturity date, issue date, rate, yield, redemption value, frequency, and basis. It returns the price per $100 face value.
- Potential errors that users might encounter when using the PRICEMAT function, such as providing invalid input values or referencing cells with incorrect data, and how to address them effectively.
- The PRICEMAT function aids in financial analysis by calculating the price of a security at maturity. This information is useful for evaluating investment opportunities, assessing bond values, and making informed investment decisions.
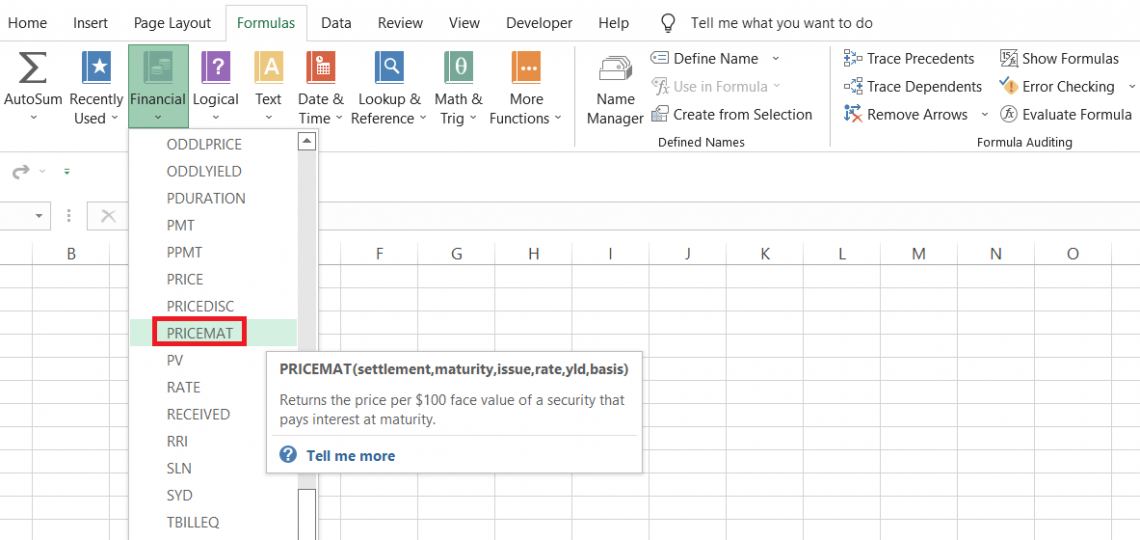
PRICEMAT function Formula
The PRICEMAT is categorized as a financial function that returns the price of $100 denomination bonds paying interest at maturity.
Generally, bonds are issued at a par price of $100. However, when they start trading on the secondary markets, the cost of the bonds faces a lot of fluctuations, mainly due to interest rate changes and other major socio-economic events.
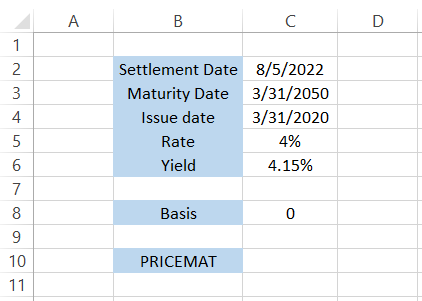
Suppose you purchase a 30-year bond that gets settled at the T+2 date on 5th August 2022. The issue date for the bond is 31st March 2020, while the maturity date is 31st March 2050.
The interest rate at the time of the bond issue was 4%, while the annual yield was 4.15%. Based on these parameters, if you use the function, you will get a bond price of $93.05(rounded off to two decimal places).
The syntax for the function is:
=PRICEMAT(settlement, maturity, issue, rate, yld, [basis])
where,
- settlement - (required) the settlement date for the bond
- maturity - (required) maturity date for the bond
- issue - (required) issue date for the bond
- rate - (required) the interest rate for the bond at the time of issue
- yld - (required) the annual yield on the bond
- basis - (optional) the financial day counting basis that will be used for the bond.
It can take different values, as illustrated below:
| Basis Value | Day Count Basis |
|---|---|
| 0 / default | US (NASD) 30/360 |
| 1 | Actual/actual |
| 2 | Actual / 360 |
| 3 | Actual / 365 |
| 4 | European 30/360 |
How to use the PRICEMAT Function in Excel?
The PRICEMAT function can initially look difficult to use since there are six different arguments that you need to observe.
However, that is not the case. Instead, it would help if you used the function a couple of times by inputting different values, and you will get the hang of it.
Assume that you have the data as illustrated below:
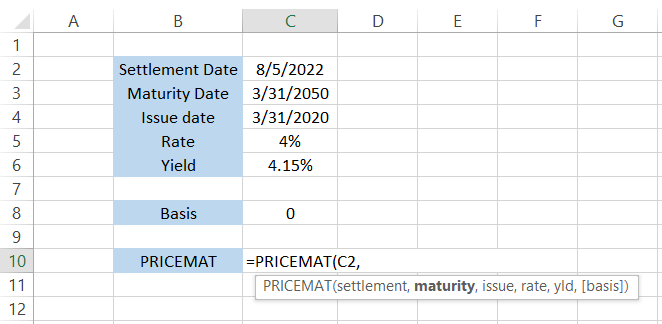
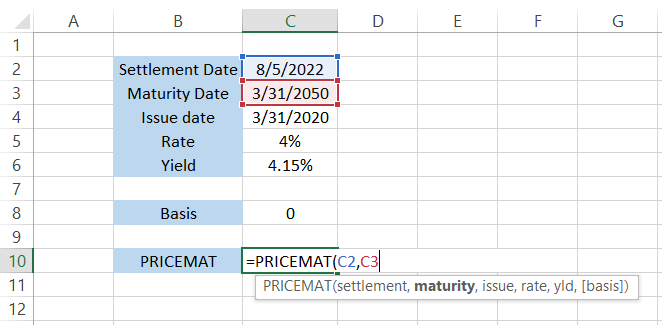
Step 1: Settlement
To calculate the security price, we will begin with an equal sign(=) in cell C10, followed by the function name. After that, we can either hardcode all the values or reference the cells that contain our argument values.
The first value that we will reference is the settlement date. The date on which the ownership of the bond or securities is transferred to the investor is called the settlement date.
The settlement date for securities is generally T+2 days, meaning if you bought the stakes on Monday, the ownership is transferred to you by Wednesday.
The formula in Excel will be
=PRICEMAT(C2, maturity, issue, rate, yld, [basis]).
Step 2: Maturity
The following argument is the maturity date for the bond. All types of investments carry some or other risk, including credit risk.
When the borrower cannot meet their debt obligations, the investors are exposed to credit risk. In addition, at the bond's maturity, investors expect to earn their principal amount and interest.
In this case, the bond's maturity date is 31st March 2050. By referencing the cell in the formula, we get
=PRICEMAT(C2,C3, issue, rate, yld, [basis])
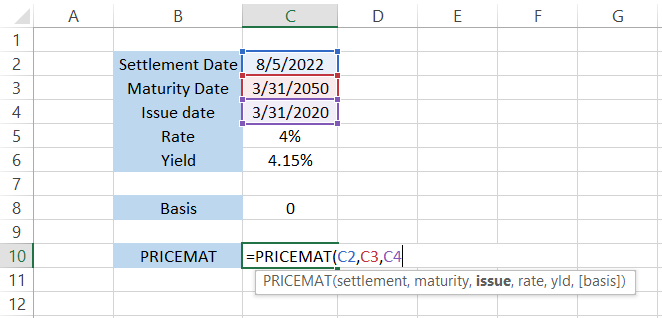
Step 3: Issue
The third argument in the formula is the issue date of the bond. The bond we are looking to evaluate was issued on 31st March 2020.
Based on the difference in the issue and maturity date, we can determine that it is a 30-year bond. By referencing the cell in the formula, we get
=PRICEMAT(C2,C3,C4, rate, yld, [basis])
Note
Anyone can easily make mistakes when it comes to date formats. For example, when you reference the date in the formula in the wrong form, it will return a #VALUE! Error. To avoid this, we recommend using the DATE function to input all the date values in Excel.
For example, if you need to input the date as 31st March 2022, the formula will be =DATE(2022,3,31) which lowers the chances of getting the VALUE! Error substantially.
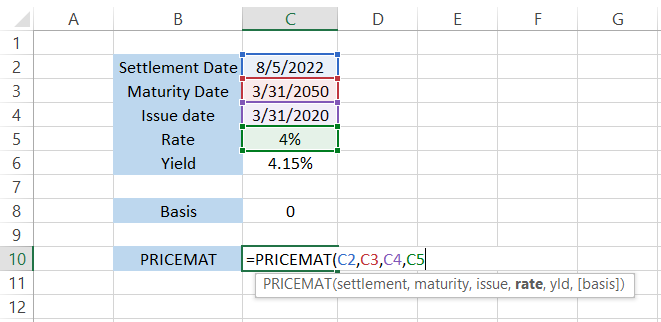
Step 4: Rate
The rate is the annual coupon or the interest rate that the bond pays the investor. The formula takes in the interest rate on the bond at the time of issue, which in this case, is 4%.
After referencing the cell C5 in the formula, we get:
=PRICEMAT(C2,C3,C4,C5, yld, [basis])
Step 5: Yld
Yield refers to the returns the investor will earn from the annual coupon payments. The easiest way to calculate the annual yield on a bond is to divide the coupon amount by the cost of the bond.
If the bond is currently trading at $96.25 and pays a coupon of 4% ($4 on a face value of $100), the yield is equal to 4.15% ($4/ $96.25). In case the price of the bond changes so does the product.
The formula after referencing the yield will be equal to
=PRICEMAT(C2, C3, C4, C5, C6),
and press Enter.
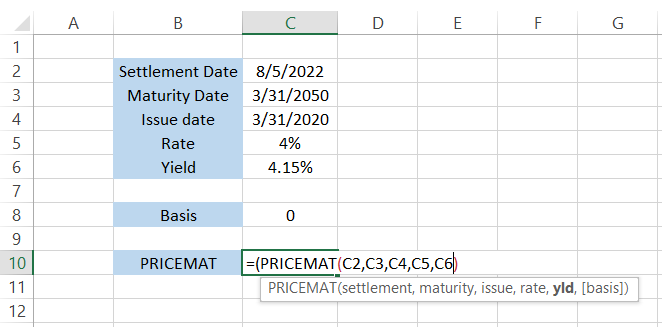
This will give us the bond price of $93.051508 in cell C10.
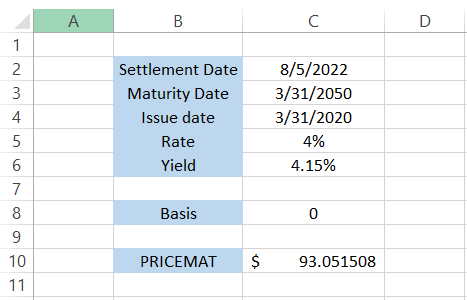
Thus, the bond price with a par value of $100, paying the interest at the end of the maturity, would be trading at $93.05.
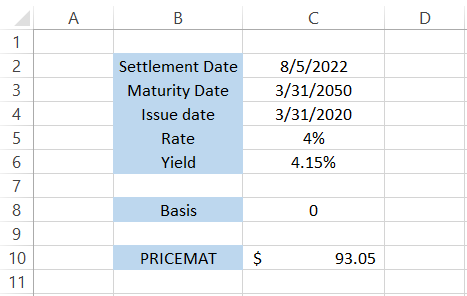
If you do not need all those extra digits after the decimal, we can use the ROUND function, which rounds up a numerical value to the 'n' digits.
The updated formula will be
=ROUND(PRICEMAT(C2,C3,C4,C5,C6),2),
which gives the result as $93.05.
Step 6: Basis (optional)
The final 'optional' argument is the basis that is used to input the day count convention. It is a system to determine standardized calculations for interest or coupon payments for a bond.
Based on the convention you use for the calculations, the value can range from 0-4, ultimately giving you varied results.
PRICEMAT function Example
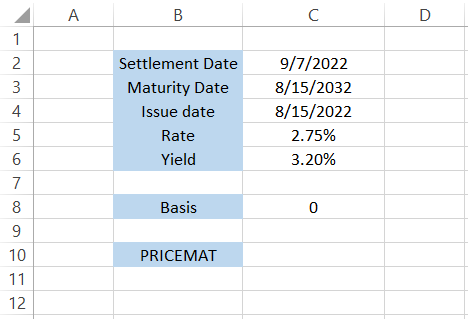
Assume that you are looking to invest in a 10-year bond. You get to CNBC and check the quote for the 10Y bond.
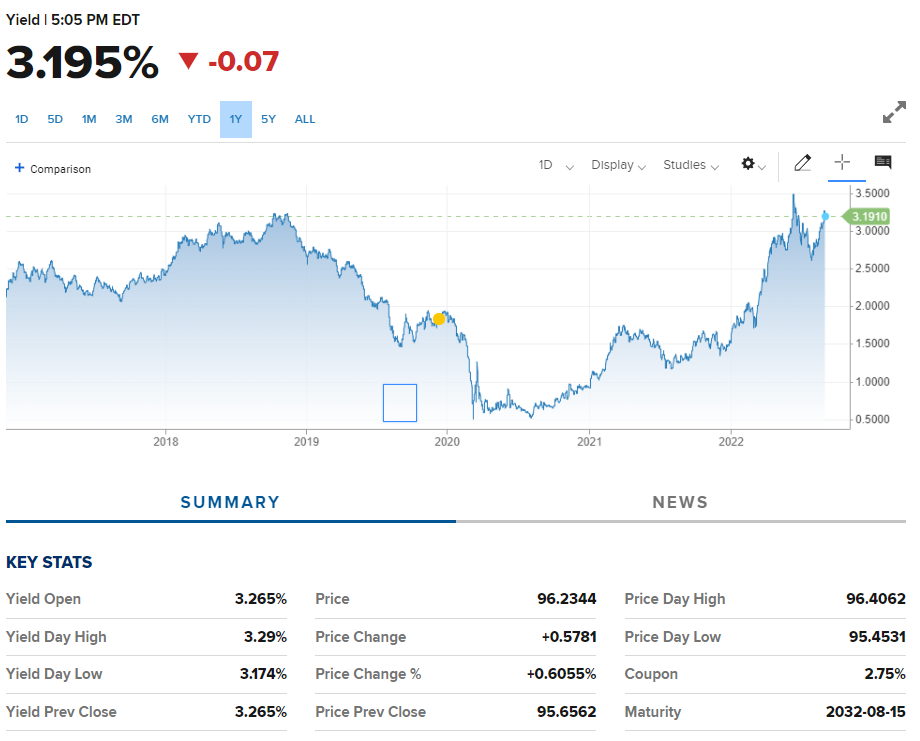
The bond yield is 3.195%, while the interest equals 2.75%. The maturity date for the bond is 15th August 2032.
Since it is a 10-year bond, we will go 10 years back, giving the assumed issue date as 15th August 2022.
You buy the bond, which gets settled on T+2 as of 7th September 2022. The data so far looks as illustrated below:
By using the formula
=ROUND(PRICEMAT(C2,C3,C4,C5,C6),2)
in cell C10, we get the result of $96.60.
This is almost exactly equal to the price CNBC is quoting on their website.

There is a bit of a difference in the price, i.e., we get the result as $96.60, whereas the website gives the price as $96.2344. However, this example aims to showcase how the function works. Therefore, the result that we get is pretty close to what the expected outcome should be.
PRICEMAT vs. PRICE function
There are a total of six price-related functions that can confuse you if you have just started the journey to becoming an Excel wizard.
However, there is a very low probability that you would use each one of those days.
The PRICE function, one of the most critical functions, calculates the price of a bond per $100 of face value. The only catch is that the bond pays interest periodically.
As opposed to the PRICEMAT, which calculates the price of a bond where interest is paid at the end of maturity, PRICE calculates the cost of a bond where coupon payments are made annually or semi-annually till the end of the maturity period.
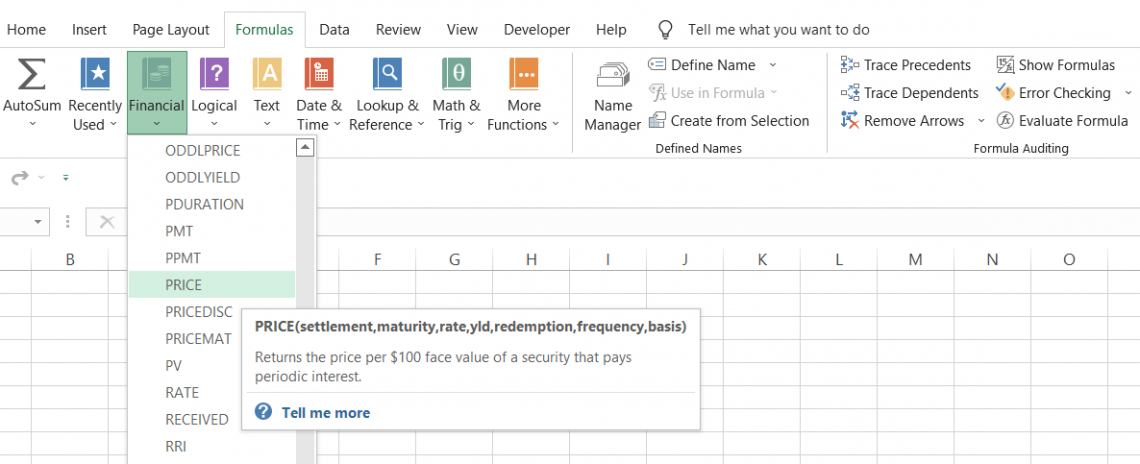
The syntax for the function is
=PRICE(settlement, maturity, rate, yld, redemption, frequency, [basis])
where,
- settlement - (required) the settlement date for the bond(usually two days after the date the bonds are purchased)
- maturity - (required) the maturity date for the bond or the date when the bond expires
- rate - (required) the annual coupon rate for the bond
- yld - (required) the annual yield or the return earned by the investors annually from the bond's coupon payment
- redemption - (required) the redemption value of the bond per $100 of the face value
- frequency - (required) number of times the coupon payments are made each year.
- basis - (optional) the financing day counting basis that will be used for the bond.
Returning to our previous example based on the data from the CNBC website, the summarized data is as illustrated below:
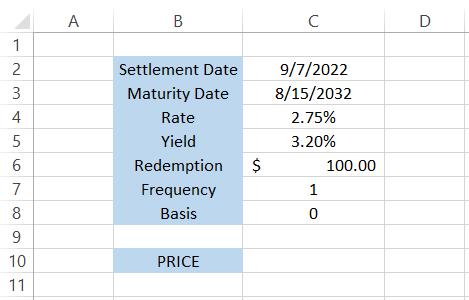
We have assumed that the bond makes annual coupon payments, i.e., the frequency is equal to one, while the redemption value at the time of maturity will equal the par value of $100.
By using the formula
=PRICE(C2,C3,C4,C5,C6,1,0) in cell C10,
we get the result of $96.26.
The result is even closer to the price quoted on the CNBC website, where the bond price equals $96.2344.

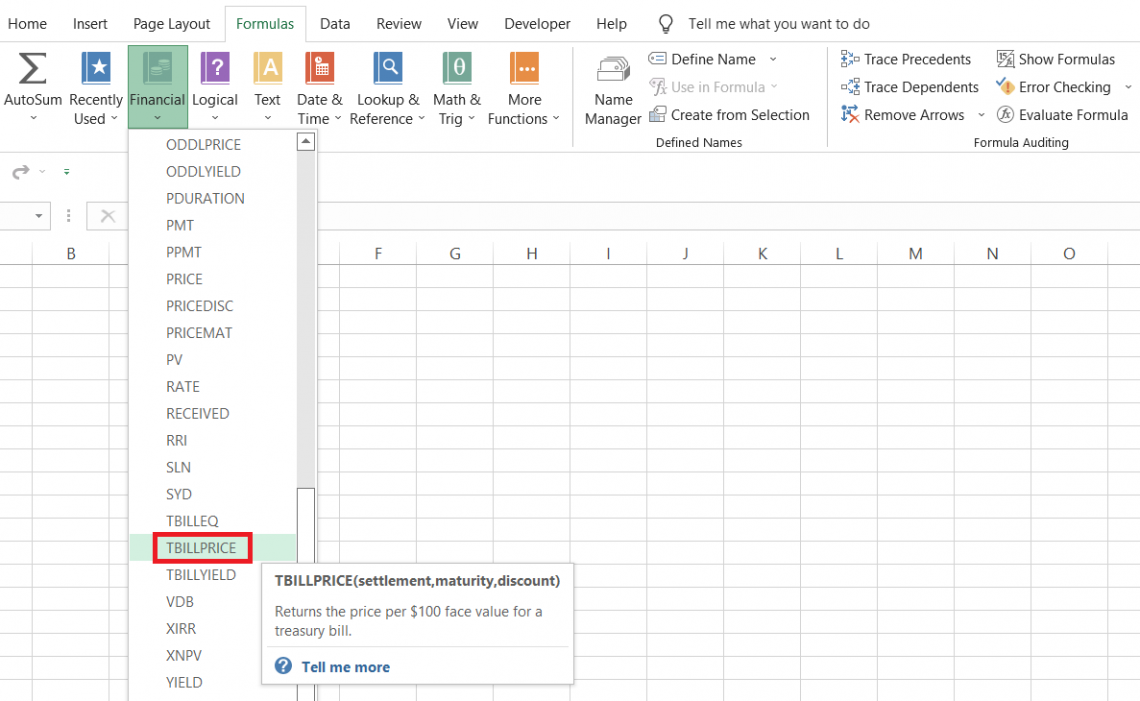
PRICEMAT vs. TBILLPRICE function
Another function you might need to consider while calculating the price of fixed-income instruments is the TBILLPRICE function.
The TBILLPRICE function calculates the price of the treasury bill with a face value of $100.
The similarity between both functions is that both have the underlying assumption of interest payments made at the end of the maturity period.
However, the difference, on the other hand, is that TBILLPRICE calculates the price of treasury bills while PRICEMAT traditionally calculates the bond price.
The syntax for the TBILLPRICE function is
=TBILLPRICE(settlement, maturity, discount)
where,
- settlement - (required) the settlement date for the treasury bill
- maturity - (required) the maturity date for the treasury bill
- discount - (required) the discount rate in percentage for the T-bill
Since treasury bills have one year or less maturity, the function will return an error if the maturity date is more significant than 365 days.
Suppose that you have the data as illustrated below:
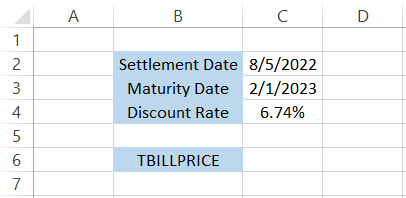
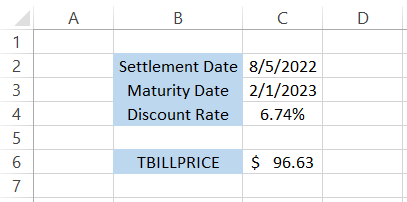
Then, the formula to calculate the price of the T-bill will be
=TBILLPRICE(C2, C3, C4),
which gives us the result of $96.63.
This way, all the price functions falling under the financial category play a unique role in calculating the price of fixed-income securities based on different criteria.
Free Resources
To continue learning and advancing your career, check out these additional helpful WSO resources:
or Want to Sign up with your social account?