POISSON.DIST Function
An Excel statistical function that returns the Poisson distribution


What Is The POISSON.DIST Function?
The POISSON.DIST function is an Excel statistical function that returns the Poisson distribution.It is a probability distribution used to model the number of events occurring within a specified period.
For the Poisson distribution to be accurate we need the following:
- The events must be independent of one another
- The rate of events must be constant over the period of time
- The events must not occur simultaneously
The Poisson distribution is best applied in cases when you need to figure out how many times a specific event occurs based on one or more explanatory variables.
More specifically, in finance, the Poisson distribution can be used to predict the number of trades made by a typical investor or the number of market crises in a specified time period.
The POISSON.DIST function was introduced in the Excel 2010 version. The function replaced the POISSON function as it provides improved accuracy, and its name better reflects the usage.
The POISSON function is still available in the latest Excel version, so one can use it for comparability with Excel 2007 and earlier versions.
When it comes to the POISSON.DIST function, Excel allows you to calculate the cumulative Poisson distribution function and the Poisson probability mass function.
Key Takeaways
- The POISSON.DIST function is one of Excel’s statistical functions.
- The function returns the Poisson distribution.
- It allows you to address questions from various fields that start with “What is the probability of.”
- Certain preconditions must be met for the Poisson distribution to be accurate.
- The POISSON.DIST allows you to determine the cumulative Poisson probability and the Poisson probability mass function.
- While the function can be accessed through the “Formulas” tab, it can also be manually inputted into any cell on a worksheet.
- The function returns errors when either x or the mean arguments are less than zero or if they are non-numeric values.
Understanding The POISSON.DIST Function
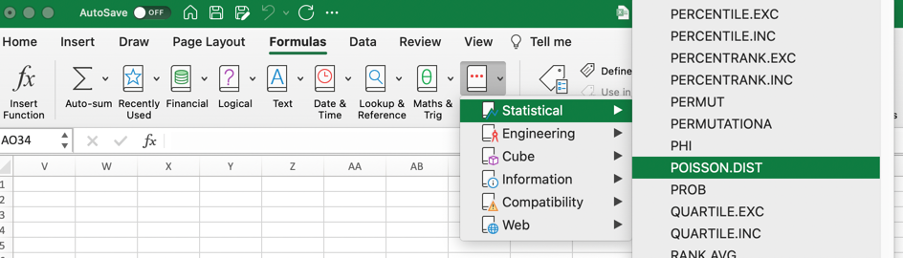
It is one of the functions that fall under the “Statistical” functions category. While there are multiple ways to access the function in Excel, one would usually start with the “Formulas” tab located at the top of the spreadsheet.
Once you get acquainted with the function, however, another option will become available. Select any cell in the worksheet and start typing in the following function:
=POISSON.DIST(x; mean; cumulative)
The function uses the following arguments:
- x (required): Equates to the number of events.
- Mean (required): The positive expected numeric value.
- Cumulative (required): The logical value that either returns the cumulative Poisson probability (if TRUE is selected) or the Poisson probability mass function (if FALSE is selected).
The cumulative Poisson probability returns the probability of the number of random events occurring at most x times (in other words, less than or equal to the value of x):

Where:
- e: the base of the natural logarithm (equal to 2.71828).
- k: the number of occurrences of an event.
- k!: the factorial of k.
- λ: positive real number, equal to the expected number of occurrences during the given interval.
On the other hand, the Poisson probability mass function returns the probability of the number of events occurring exactly x times:

Where:
- e: the base of the natural logarithm (equal to 2.71828).
- x: the number of occurrences of an event.
- x!: the factorial of x.
- λ: positive real number, equal to the expected number of occurrences during the given interval.
Note
The function truncates the x argument if a non-integer value is entered. In other words, it automatically eliminates the numbers after the decimal point.
POISSON.DIST Function Examples
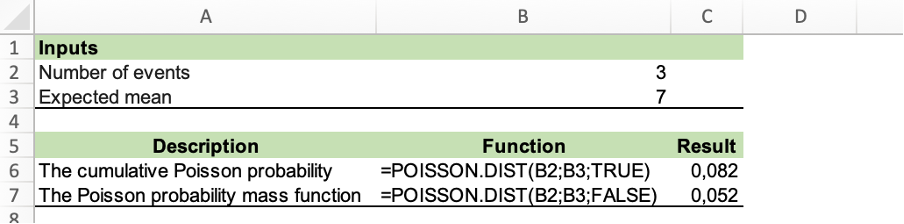
Consider an event with three occurrences and the expected mean of seven. The POISSON.DIST function will yield the following results:
Now, let’s consider a few more practical examples:
Example 1: A supermarket sells, on average, 100 bags of potatoes per day. What would be the probability that the supermarket sells 110 bags of potatoes on any given day?
The number of occurrences over a given period of time is 110, while 100 is the expected mean. We want to determine the exact probability, thus selecting FALSE for the cumulative argument.
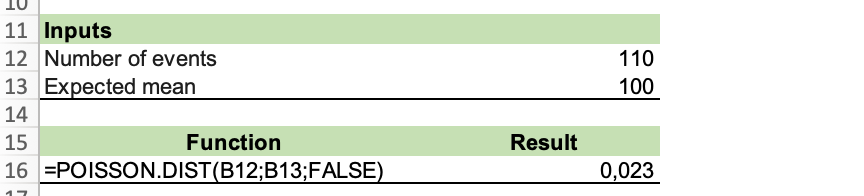
The probability of a supermarket selling 110 bags of potatoes on any given day is 0,023.
Example 2: On average, a sporting goods store sells 10 cans of tennis balls. What would be the probability that the store sells 5 or fewer cans of tennis balls on any given day?
The number of occurrences over a given period is 5, while 10 is an expected mean. In this case, we want to find out the cumulative probability, thus selecting TRUE for the cumulative argument.
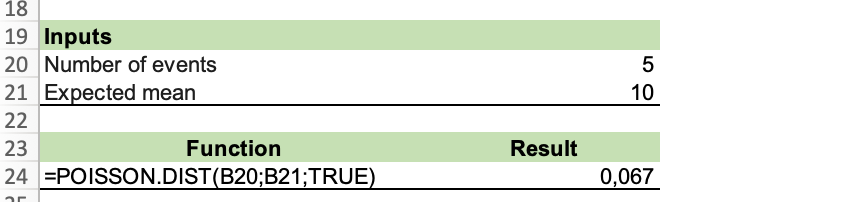
The probability of the store selling 5 or fewer cans of tennis balls on any given day is 0,067.
Remember that errors occur if:
- Either the x or the mean arguments are non-numeric. The #VALUE! error is returned here.
- Either the x argument or the mean argument is less than 0. The #NUM! error value occurs here.


or Want to Sign up with your social account?