Forecast Trend & Extrapolate Excel
It is a tool that can help individuals and businesses predict future trends based on their historical data


What Are Forecast Trend & Extrapolate In Excel?
In Excel, "Forecast" and "Extrapolate" are techniques used to predict future values based on existing data.
Forecasting is the process of foretelling coming issues grounded on former data. This can be helpful for associations looking to forecast coming trends and make informed opinions.
From forecasting coming trends to connecting patterns and outliers, data analysis plays a critical part in shaping business strategy and driving success. For example, a retailer may use forecasting to forecast coming deals trends, allowing them to accommodate their stock or marketing strategy consequently.
On the other hand, extrapolation is a specific type of predicting that involves extending the trendline of a data set beyond the known data points. This can be helpful for associations looking to forecast coming issues beyond the range of existing data.
For example, a manufacturer may use extrapolation to forecast the lifetime of a product grounded on its factual operation data.
Key Takeaways
- An extrapolation is a powerful tool that can help users to make predictions about future data trends based on historical data. The feature uses statistics to detect trends in the data and project those trends into the future.
- Users should also be aware that extrapolation involves some degree of uncertainty and exercise caution when making decisions based on the predictions generated by the feature.
- Users can pick forecasting models like linear, exponential, or polynomial to match the data and make predictions.
- To prevent overfitting and other errors, it's crucial to evaluate the forecasting models' assumptions and limitations and use the feature carefully.
what is Extrapolation?
Extrapolation refers to the process of estimating a value or a trend beyond the range of observed data. It is a mathematical technique that involves extending the trend or pattern of data beyond the known range in order to make predictions or forecasts about the future.
Economic forecasting predicts variables such as inflation, interest rates, and GDP growth by using extrapolation.
These predictions impact decisions made by businesses, investors, and policymakers. It's important to consider assumptions made during extrapolation because accuracy affects decisions.
Extrapolation assumes trends will continue, but unexpected events such as natural disasters or political upheavals can impact economic trends.
Note
Extrapolation is most commonly used in the field of economics.
Similarly, physical systems may exhibit behavior that is outside the range of observed data. Despite these limitations, extrapolation remains an important tool for making predictions and forecasts.
By carefully considering the underlying assumptions and limitations of this technique, it can make informed decisions and predictions about the future.
Features of Forecast Trend & Extrapolate Function
The Extrapolation Function in Excel is an incredibly powerful tool that can help individuals, and businesses predict future trends based on their historical data.
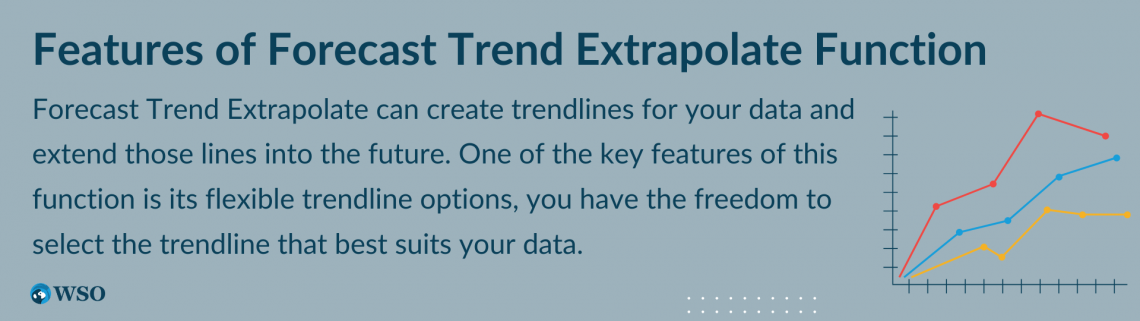
With this function, you can create trendlines for your data and extend those lines into the future, allowing you to make informed decisions based on accurate forecasts.
- One of the key features of this function is its flexible trendline options, you have the freedom to select the trendline that best suits your data.
- Another great feature of the Forecast Trend Extrapolate Function is its adjustable forecast periods. You can customize the forecast period to meet your specific needs, whether predicting trends for the next few months or the next few years.
This level of customization allows you to make decisions based on reliable data and accurate forecasts.
Note
Users can also create multiple scenarios with the Forecast Trend Extrapolate Function. This means that you can compare different projections and choose the best one for your business or individual needs.
Additionally, Excel's Forecast Trend Extrapolate Function is interactive, so you can update your data and see how those changes affect your forecast. This feature allows you to adjust your predictions as new data becomes available.
Finally, the Forecast Trend Extrapolate Function interface is user-friendly and intuitive. You don't need extensive Excel experience to create trendlines and forecasts.
Overall, the Forecast Trend Extrapolate Function in Excel is an excellent resource for anyone looking to predict future trends based on historical data.
With its flexible trendline options, adjustable forecast periods, multiple scenarios, interactivity, and user-friendly interface, this function is a must-have for businesses and individuals.

Forecasting and Trend Function
Forecasting and trend are essential tools in data analysis that enable businesses, governments, and individuals to predict future trends.
There are several techniques that the Forecast Trend Extrapolate Function in Excel uses to predict future trends.
- Time-series analysis is one such method. This technique involves studying data to detect patterns and trends over a specific period.
- Regression analysis is another method. It helps in identifying how different variables are related to each other.
Meanwhile, econometric modeling uses economic theories and statistical methods to analyze financial data.
In addition to these methods, there's also the concept of trend. Trend refers to the general direction or pattern of change in a particular variable over time.
Trend analysis involves studying past data to identify patterns and trends in a variable. This provides insights into how the variable may behave in the future, allowing predictions to be made.
By analyzing trends, spotting patterns that might have been difficult to see in individual data points becomes easy, and more accurate predictions about the future are made.
Note
Trends may be upward, downward, or horizontal (no change) and can be short-term or long-term.
Trend analysis means looking at past data to find patterns and trends in a variable. This information can help predict how the variable will behave in the future.
Forecasting and trend analysis are often used together to predict future outcomes.
By identifying trends in data, analysts develop models that are used to forecast future events.
For example, a business wants to make decisions backed by data about its sales strategy. By using trend analysis, it can identify patterns in its sales data, such as seasonal trends or changes in consumer behavior.
Difference Between FORECAST And TREND Functions in Excel
In Excel, the FORECAST and TREND functions are used to predict future values based on past data.
However, these two functions have different key features, such as:
- Input data range: FORECAST predicts one future y value with known x and y values, while TREND predicts multiple future y values with known x and y values.
- Output: FORECAST predicts one y value for a given x value, while TREND predicts an array of y values for a series of x values.
- Regression type: The FORECAST function uses linear regression to predict future values, while the TREND function can use either linear or polynomial regression to predict future discounts.
- Function syntax: The syntax for the two functions is different. The FORECAST function takes two arguments: the x value to predict the y value and the range of known x values. The TREND function, however, takes three arguments: the range of known y values, the range of known x values, and the range of x values for predicting y values.
The main difference between the FORECAST and TREND functions in Excel is that the FORECAST function predicts a single future value based on known x and y values. In contrast, the TREND function predicts multiple future values based on a known set of x and y values.
How to use the FORECAST and TREND functions in Excel?
There are different approaches for forecasting trends and extrapolating data in Excel, and the formulas can vary depending on the specific manner used.
Here are some cases:
FORECAST Function
Excel's Forecast linear function is a powerful tool that enables users to create accurate forecasts based on historical data.
This function uses a linear regression algorithm to analyze past trends and extrapolate them into the future.
To predict a trend using linear regression, you can use the following formula:
=FORECAST.LINEAR(x, known_y's, known_x's)
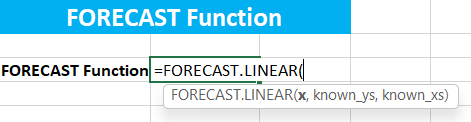
Where,
- x: The known value for which you want to forecast the value.
- known_y's: An array or range of the dependent variable ( y-axis) in the sample data.
- known_x's: An array or range of the independent variable (x-axis) in the sample data.
TREND Function
This is an Excel Statistical function that will calculate the linear trendline to the arrays of known y and known x.
=TREND(known_y’s, known_x’s, new_x’s, const)
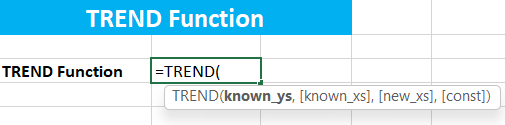
Where,
- known_y’s: This is a set of y-values we formerly knew in the relationship y = mx+b.
- known_x’s: This is a set of x-values that should be the same length as the set of known_y’s. However, the set of (known_x’s) takes on the value{1, 2,....} if neglected as it is optional.
- new_x’s: This provides one or further arrays of numeric values that represent the new_x’s value. However, it's set to be equal to the (known_x’s), if the (new_x’s) argument is neglected.
- Const: This specifies whether to force the constant b to equal 0.
- TRUE: b is calculated typically.
- FALSE: b is set equal to 0 (zero), and m-values are revised so that y = mx.
The TREND function uses the least squares system to find the line of best fit and also uses it to calculate the new y-values for the supplied new x-values.
Forecast Function Example
Let's look at an example of the FORECAST Function in Excel:
1. Suppose you want to forecast the profit from your sales from July to December.
2. You will first have to get the data of the sales done in the first six months, i.e., January to June, and the profit acquired from them.
3. Now put that data in your spreadsheet as shown below:
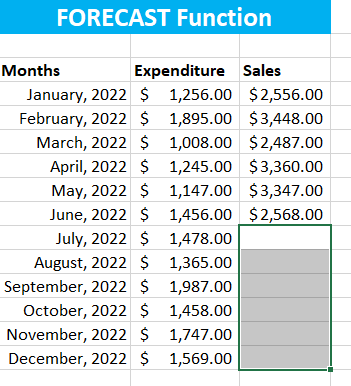
4. Now that you have the data in your spreadsheet, use the expenditure of the first half of 2022 to forecast the earnings of the other half using the FORECAST.LINEAR function.
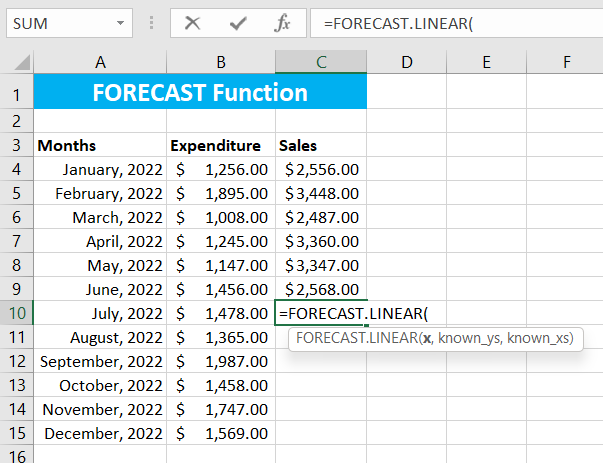
5. Refer to the formula given above and use appropriate arguments for the function as shown below:
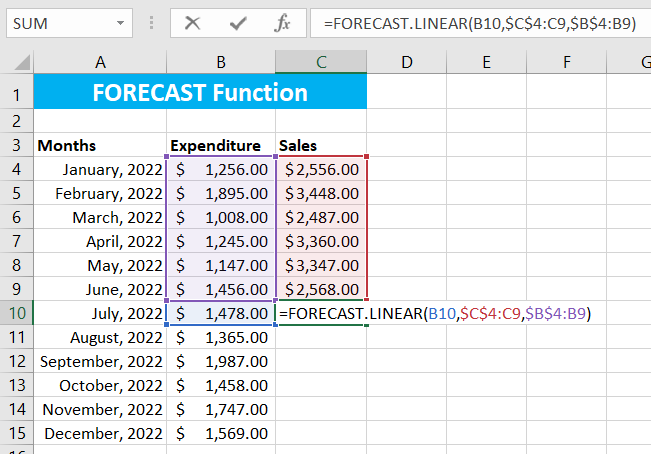
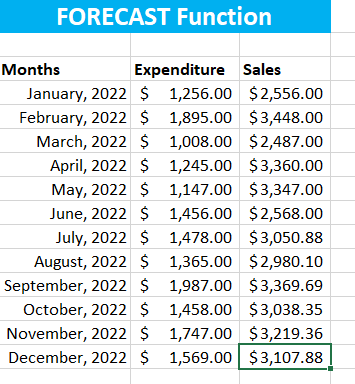
6. Now, you can calculate the forecasted sales for the other half of 2022.
Trend Function Example
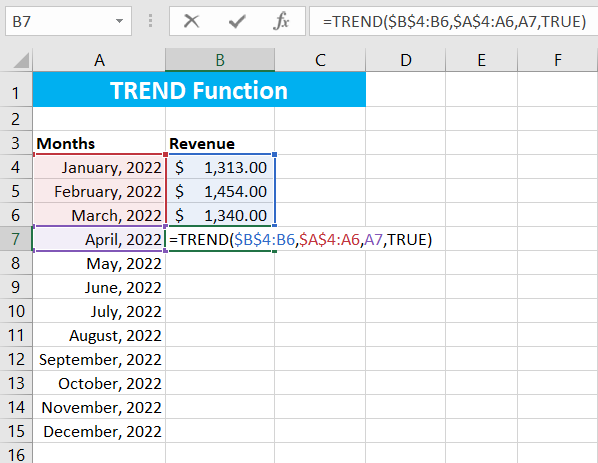
Let's look at an example of how to use the TREND function in Excel:
1. Let's figure out the future revenue of a company using the revenue it generated in the first three months of Fiscal year 2023.
2. Collect the data and put it in the spreadsheet of MS Excel as given below:
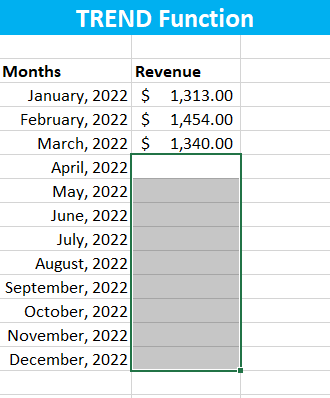
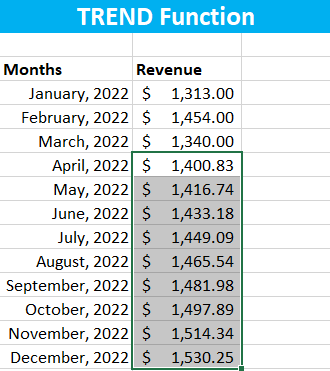
3. Now, using the TREND function above, calculate the revenue.
4. You can calculate the revenue for all the remaining months similarly.
or Want to Sign up with your social account?