F.INV Function
An Excel Statistical Function that helps users calculate the F-Probability Distribution that measures the variance between two sets of populations.


What Is The F.INV Function?
The F.INV Function is an Excel Statistical Function that helps the users to calculate the F probability distribution, which measures the the variance between two sets of population.
The F.INV distribution function is most helpful when finding the inverse of a probability. However, if the dataset for a probability is skewed more to the left or more to the right, then the results may be inaccurate and skewed in that direction.
The F.INV Function is valued when analyzing the variability between two sets of data. This can include calculating variances between two regions and their incomes and expenditures.
Using this technique, we can understand the variance between income levels of two different regions. And how they expend their incomes.
However, if the distribution probability is greater than or equal to fifty percent, you will receive a more accurate and less biased return.
Another scenario in which your results may be inaccurate is if the F.INV distribution function is used to calculate a matrix. As stated, the F.INV distribution function is most compatible with F probability distribution datasets.
Matrices, however, may contain data that is less compatible with the functionalities of the F.INV distribution function. Therefore, other Excel functions, such as the ARRAY function, may be more suitable if you wish to calculate a matrix.
Moving forward with what the F.INV function offers, this article will highlight a few of its essential features.
First, we’ll examine the formula and break down each component to better understand it. Next, we'll provide a brief example of using the F.INV distribution function.
The F.INV distribution function example will include a detailed look at one useful scenario and a follow-through series on navigating the function in an Excel sheet.
Key Takeaways
- The F.INV function in Excel is a statistical function used to return the inverse of the cumulative distribution function (CDF) for the F-distribution. It returns the critical value at a given probability level for the F-distribution.
- The syntax includes three arguments: probability (the probability associated with the F-distribution), degrees_freedom1 (degrees of freedom of the numerator), and degrees_freedom2 (degrees of freedom of the denominator).
- The F.INV function may return errors if the probability argument is non-numeric, less than 0, or greater than 1, or if the degrees of freedom arguments are non-numeric or non-positive integers. In such cases, it may return a #VALUE! error.
- The F.INV function is commonly used in statistical analysis, hypothesis testing, and quality control to find critical values for the F-distribution. It helps determine the probability at which the probability is reached in an F-distribution.
How F.INV Function Works?
To calculate the inverse of a given probability distribution, the function needed is as follows:
F.INV(probability, deg_freedom1, deg_freedom2).

In further breaking down the three components of the function, let’s take a closer look at what each entails in determining the inverse.
When you are looking to find the inverse of a distribution, also known as “undoing” a function, you will need to know the probability of the given dataset.
As an essential and required aspect of the formula, the “probability” component will include the information from the F probability distribution.
Next, you will want to look at the degree of freedom of the dataset. As another required component, the “deg_freedom1” is the second aspect of the formula associated with the numerator of the F.INV distribution function.
Lastly, the “deg_freedom2” considers the degree of freedom of the denominator. Similar to the first two components, the “deg_freedom2” is a required part of the function as it is included in the overall computation of the inverse.

An Example Of F.INV Distribution
In the example below, the F probability distribution offers a probability of 0.5. In a camp of 6 students, given two choices, all students have to agree to participate in a two-week-long physical activity.
If half the camp chooses to kayak and the other half chooses to surf as their choice of physical activity, we will calculate the inverse of the given data.
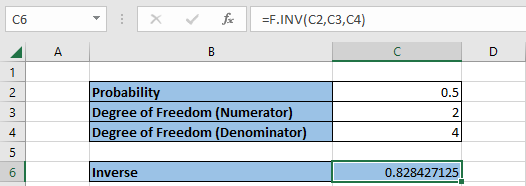
The degrees of freedom from the numerator and denominator are also entered as numerical sets. In the numerator portion, 2 students voted for kayaking, and 4, in the denominator portion, chose to vote for surfing.
With the data given, the inverse returns a 0.828427125, or 83% vote for surfing.
Also, the F.INV function can be depicted in the highlighted cell in C6 and broken down to show its necessary components.
NOTE
For a refresher on what the F.INV distribution function requires, the Formula section can help review.
After entering the data in a structured table, you can locate the function in two ways. One way is to select a cell in which you wish to input the returns. It would be best to maintain the structured table for easier locating.
In this example, the table categorized as “Inverse” is where the function is being inputted for its calculated returns.
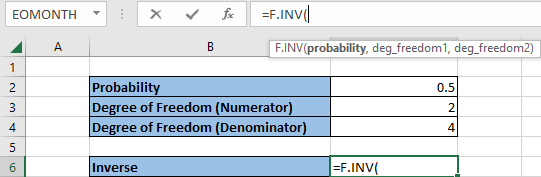
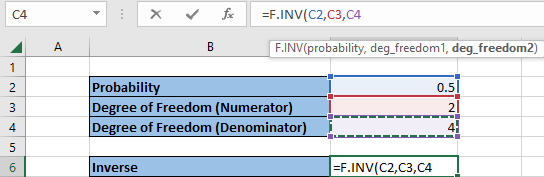
Then, type “=F.INV” and the function should appear promptly. Following that, you can highlight the cells with the necessary data to include in its calculation. Below, you will see the order in which the components are organized or highlighted.
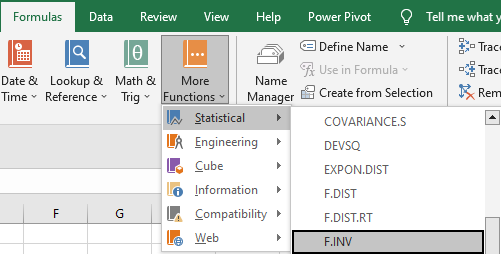
Another way to locate the F.INV function is to follow the steps as directed in the instructions:
- In the Excel sheet, locate the Formulas tab at the top bar
- Click on More Functions
- In the dropdown bar, you will see six additional categories. Click on Statistics
- Another dropdown bar will appear with functions in alphabetical order. Simply scroll down and locate “F.INV”.
If the inverse returns as an error of #NUM! Or #VALUE!, consider two of the following situations:
- There is a value of zero or greater than one in the probability section
- A value of less than one is inputted in both degrees of freedom.
Remember to utilize the F probability distribution to determine the probability of your dataset's probability and the degrees of freedom required.

Free Resources
To continue learning and advancing your career, check out these additional helpful WSO resources:

or Want to Sign up with your social account?