F.DIST.RT Function
An excel statistical function that calculates the right-tailed probability of the F distribution for a given input x(F statistic)


The F Dist Rt function is an excel statistical function that calculates the right-tailed probability of the F distribution for a given input x(F statistic).
F statistic is a ratio of sample variances of two groups. This function is used in statistical analysis for hypothesis testing to compare the variances of two groups or populations. For example, we can compare the performance of employees from two different departments.
The null hypothesis is that the two populations have the same variance, while the alternative hypothesis is that they have different variances. This function calculates the probability (p-value) of observing the F-test statistic, assuming the null hypothesis is true.
If the p-value is small, it indicates that the difference we observe in the variances is not by chance, and we reject the null hypothesis. This function was launched in Excel 2010 and is an updated version of the F dist function.
When using this function, it is important to note that it calculates the right-tailed probability of F distribution, meaning that it calculates the probability of observing the F statistic greater than or equal to the given value.
Key Takeaways
- F.DIST.RT calculates the right-tailed F probability distribution for a given F statistic input and degrees of freedom.
- It is used in hypothesis testing to determine if the variance between two data sets is statistically significant.
- The F distribution compares variances of two or more groups to assess if differences are due to chance.
- F.DIST.RT returns the cumulative distribution function value for the right tail of the F distribution.
- When using F.DIST.RT, it's important to confirm inputs are numeric to avoid errors and ensure accurate statistical significance testing.
What is F Distribution?
The F distribution is a mathematical function used in statistical analysis to compare the variance of two or more data sets.

It is calculated based on two sets of numbers called the degrees of freedom, representing the sample size of each group being compared. It was developed in the early 20th century by a statistician known as R.A. Fisher.
F distribution helps data analysts determine if the groups' differences are meaningful or just due to chance.
To determine if the differences between groups are meaningful, researchers use an alpha level set at 0.05.
This means there is a 5% likelihood that any difference we observe is due to chance.
If the calculated F-value is greater than the critical F-value at the chosen alpha level, then the difference between the groups is meaningful.
Critical F-value is determined by degrees of freedom of the numerator and denominator and the chosen alpha level.

We can also use f distribution in Regression Analysis to test the overall significance of the model.
Its uses are in the field of research such as economy, experimental psychology, and biology to compare the effects of different treatments or interventions.
NOTE
The variance between groups is the variability between means of the groups we are comparing, while variance within groups is the variability within each group.
Properties of F Distribution
The F distribution has several useful properties in statistical calculations. We have listed some of these properties below:
1. Skewness
The F distribution is not symmetrical; rather, it is skewed in nature, and the amount of skewness of the distribution depends on the degrees of freedom.

2. Degrees of Freedom:
The F distribution has two degrees of freedom. They are the numerator and denominator degrees of freedom, respectively. They represent the shape and location of the F distribution.
3. Sum of squares:
A comparison between variances of two populations is made with the help of F distribution. It does so by dividing one Chi-square by another, which has different degrees of freedom.
4. Relationships to other distributions:
The F distribution is related to distributions such as the Chi-square distribution and Student’s t-distribution.

How to use the F dist rt function in Excel?
You can solve the F distribution in Excel using the F dist rt function. The formula is as follows

Where the parameters of this formula are given below:
- x - The value at which you want to evaluate the F distribution.
- Deg_freedom1 - The numerator degrees of freedom of F distribution.
- Deg_freedom2 - The denominator degrees of freedom of F distribution.
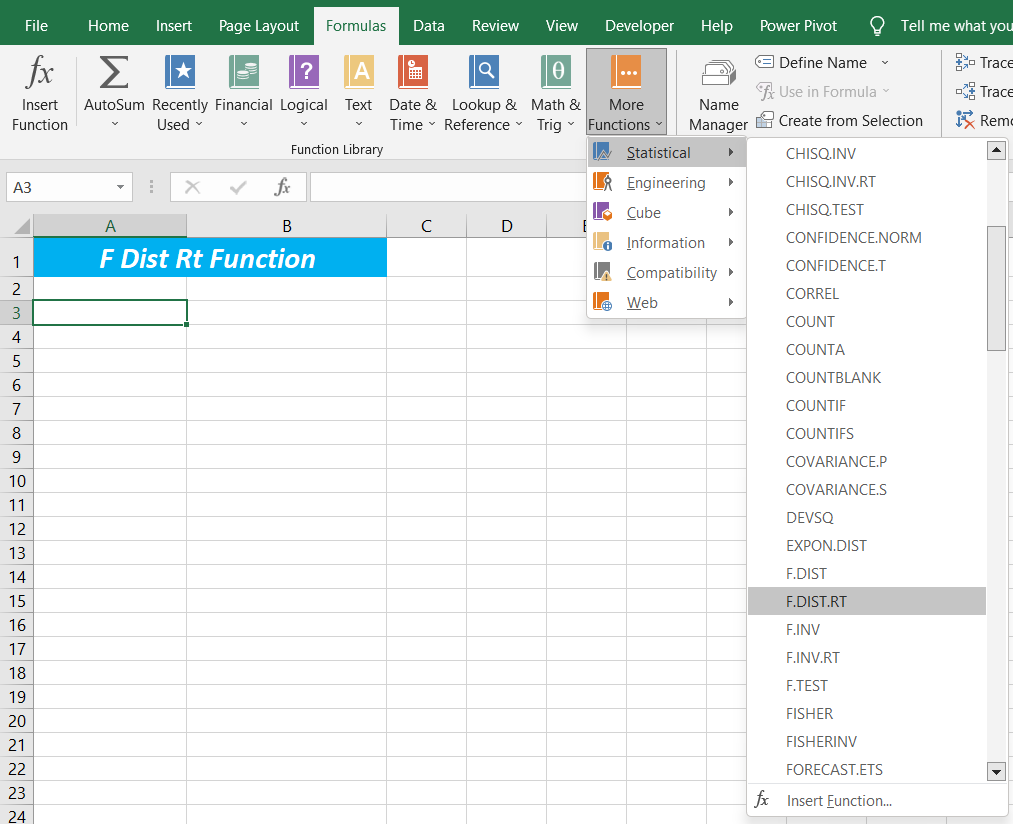
F dist rt function is a statistical function found in the formula bar of Excel, or you can simply type it out in the cell.
This function takes three arguments, the value at which to evaluate the function, the degree of freedom of the numerator, and the degree of freedom of the denominator.
F dist rt function is mainly used to calculate probabilities, but we can also use it to perform hypothesis tests.
Let’s try better to understand this with the help of an example.
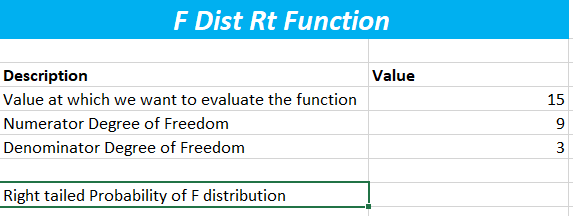
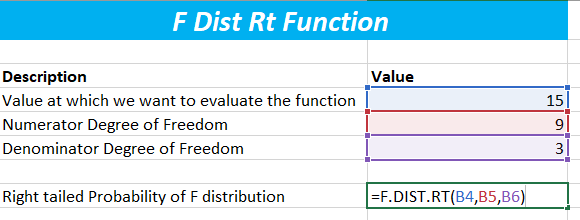
Let us assume that the value at which we want to evaluate the F distribution is 15.
Also, assume that the numerator degree of freedom is 9 and the denominator degree of freedom is 3.
Let's open a new Excel spreadsheet and put the above-given data in it.

Now, calculate the right-tailed probability of the given F distribution with the help of the F Dist Rt function.
We can find this function in the statistical functions in the formula bar or simply type it out just as given below.
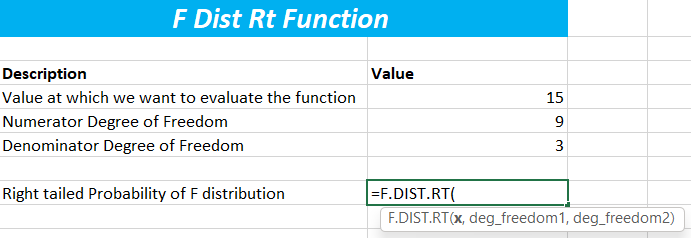
Now put in the values of the parameters or make references to the given values as given below.
Now calculate the function by pressing the enter key of your keyboard.
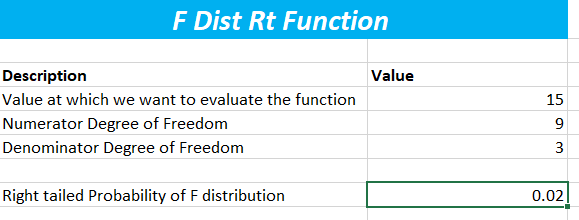
The result is 0.02, meaning the probability of the F-value being less than or equal to 15 is 0.02.
This is called the Cumulative Distribution Function of the F distribution.
If you want to find the probability of the F-value being greater than or equal to 15, you can subtract the CDF from 1.
Errors in calculating F Dist Rt Function
While calculating with the F dist rt function, you might encounter many errors. Making errors in Excel is very common, but trying to get them right might prove troublesome.
Here are a few errors you might encounter while calculating the F dist rt function in Excel and methods on how to correct them.
1. #VALUE! Error:
This error occurs when the parameters of the function are non-numeric. Kindly check all your parameters and ensure all the values are numeric.

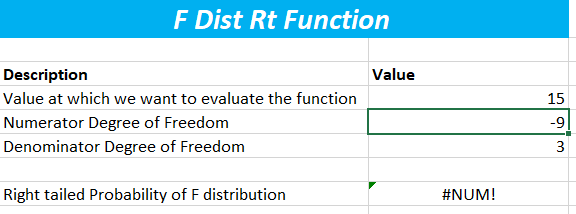
2. #NUM! Error:
This error occurs when the function parameters are invalid or inappropriate. Ensure that the arguments are not less than zero and that the numerator degree of freedom is less than or equal to the denominator degree of freedom.
3. #REF! Error:
This error occurs when the reference in the formula is incorrect or invalid. Ensure that the reference to the cells is correct and all the referred cells have a numeric value.
4. Incorrect Result:
Sometimes, you might not get the results you expected from the formula. Ensure you are using the function correctly, including the order of parameters and formula.
5. Round-Off Errors:
Excel sometimes automatically rounds off the digits to make them fit for the cell, which might result in a small error in the results. Ensure all the arguments and formulas are used correctly to avoid errors while calculating the F distribution.
Double-check the inputs in the cells and ensure all numeric values and degrees of freedom are appropriate. If you still have problems, refer to Excel’s documentation or consult an expert.


or Want to Sign up with your social account?